FAO brings food loss data together
How a global database helps target action more effectively
Reducing food loss starts with better data. As more countries and organizations step up efforts to tackle the issue, better information is helping to show where losses occur and where action can have the greatest impact. Through its food loss and waste database, the Food and Agriculture Organization of the United Nations (FAO) in Rome brings together evidence from across countries, products, and supply chains, creating a resource that supports global monitoring and helps to make more informed decisions. The Permanent Representation of the Netherlands to the FAO supports these developments.
Reducing food loss and waste is increasingly seen as an important part of creating more sustainable and efficient global food systems. For policymakers, knowledge institutions, and agribusiness, this is both a challenge and an opportunity to contribute expertise in areas such as supply chain efficiency, technology, and circular solutions. For Dutch stakeholders, better international data can help show where knowledge, innovation and investment can have the greatest impact. FAO plays a key role here as the custodian of SDG indicator 12.3: halving per capita global food waste at retail and consumer level and reducing food losses along production and supply chains by 2030.
Beeld: © FAO
Carola Fabi, senior statistician and methodological innovation team leader at FAO’s statistics division
Data is the starting point for reducing food loss and waste. At FAO, a dedicated team in the statistics division has developed a global database that makes this data accessible: the Food Loss and Waste Database. According to Carola Fabi, senior statistician and methodological innovation team leader at FAO’s statistics division, the database was originally created to solve a very practical problem: there was very little or no reliable data available to monitor global food loss targets. ‘When the Sustainable Development Goal target on food loss and waste was adopted, we had to develop a model to estimate global losses,’ says Fabi, ‘and for that we needed to gather and structure all the information that existed.’ Over time, what started as an internal dataset has become the most widely used resource on FAO’s food loss and waste platform.
From scattered studies to structured data
Food loss data exists in many places, including academic papers, value chain studies, development reports, and experimental research. These data may come from sample surveys, experimental designs, expert opinions from qualified informants, or high-level estimates derived from commodity balances. They may cover only one region of a country, a single stage of the supply chain, or one type of actor, such as smallholder farmers. Alternatively, they may provide estimates at the national level.
Unfortunately, this information is rarely presented in a standardized format. To address this, FAO’s database brings together scattered findings in a structured dataset that can be analyzed and compared. ‘The data does not start as a structured dataset,’ Fabi explains.
‘We take numbers from studies and reports, where they appear in unstructured form, and organize them into a structured dataset that can be queried, analyzed, and reprocessed.’
Today, the database contains around 30,000 individual data points (one single piece of information in a dataset) covering different products, supply chain stages, and countries. Yet, according to Fabi, this number can be misleading. ‘Thirty thousand data points sound like a lot,’ she says. ‘But when you break it down by country, product and stage of the supply chain, there are still many gaps.’ For example, while cereals and fruit and vegetables are relatively well documented, there is very little data on livestock losses, sugar crops, cocoa, coffee, roots and tubers, or fish.
‘When the SDG target on food loss and waste was adopted, there was almost no data available’
Keeping the database up to date
What surprised FAO the most is how widely the database is used. Consulting firms, researchers, international organizations, and development institutions regularly access the platform. ‘The database page is actually the most visited page on our technical platform,’ Fabi says. ‘It even receives more visits than the homepage. That shows that people are really looking for evidence.’
Keeping the database up to date is a continuous effort. Each year, FAO screens hundreds of new scientific articles and reports using automated search tools. A machine-learning model helps identify potentially relevant publications, after which analysts review the material and – with the help of another machine learning tool – extract usable data points and related products, geographical area, stage of the supply chain, data source and data collection methods.
‘Only about 30% of the articles flagged as relevant actually contain usable data,’ Fabi notes. ‘Many articles merely repeat findings from earlier studies already included in the database, present overly aggregated estimates, or provide too little methodological detail to allow a new row to be coded correctly. Each extracted data point is then manually checked and validated before being added to the database, with additional statistical checks to detect extreme outliers or inconsistencies.’
Beeld: © FAO
Box plot type of chart, produced with the FLW database, summarizing all the food loss data from 2015 onwards
Demand-driven support for countries
Besides compiling global data, FAO also supports countries measure food loss themselves. However, the process is largely demand-driven. ‘We do not go to countries and tell them they must measure food loss,’ says Fabi. ‘They contact us when they want support, for example to analyze losses of a particular product or to integrate food loss into their statistics to monitor their national Food Loss and Waste (FLW) reduction strategy or reduce post-harvest losses in the framework of rural development policies.’
In many developing countries, losses in staple crops such as maize can be particularly high, sometimes combined with food safety issues such as aflatoxin contamination. Other countries focus on highly perishable products like fruits and vegetables, where losses can reach 30% and even 40% between farm and market in some cases. FAO mainly focuses on food loss before the retail stage, which falls under its mandate within the Sustainable Development Goals. Food waste at retail and household level is monitored by the United Nations Environment Programme (UNEP).
Creation of two indices to measure progress towards SDG 12.3
The Food Loss and Waste Database, together with the Food Loss Index (FLI) and the Food Waste Index (FWI) – the latter developed in collaboration with United Nations Environment Program (UNEP) – forms a complementary system that links raw data to standardized global measurement. The data compiled in the database is translated into the FLI and FWI as harmonized indicators for monitoring progress towards Sustainable Development Goal (SDG) 12.3. The FLI focuses on losses from the post-harvest stage up to, but not including, retail, expressing them as a percentage based on modelled and weighted data across commodity groups. The FWI, by contrast, captures waste at the retail, food service, and household levels and expresses it in kilograms per capita.
For example, studies in a given country may report different loss rates for stored maize, such as 10 percent and 18 percent, as well as different estimates of household food waste, such as 60 kg and 80 kg per person per year. These individual data points may all appear in the database, but the FLI and FWI use them to generate single national estimates, such as 14 percent food loss and 70 kg of food waste per capita. This makes it possible to compare countries consistently and to track progress towards SDG 12.3 over time.
Beeld: © FAO
Maize loss in Bungoma, Kenya
Slow progress in national statistics
Despite growing awareness, food loss data is still difficult and costly to collect. Measuring losses requires information from multiple points along the supply chain: farms, storage facilities, processors, transport, and markets. ‘Behind a single number of food loss there are often several surveys,’ Fabi explains. ‘That makes it complex and relatively expensive to produce good data.’
As a result, only a limited number of countries currently include food loss questions in their agricultural surveys, such as Mexico, Colombia, and Ethiopia. Still, progress is visible. ‘If we compare the situation today with ten years ago, many things have improved,’ she says. ‘The amount of data has increased a lot. Although gaps are still present, many more regions and commodities are monitored now. But it is a long journey.’
Opportunities for Dutch stakeholders
For Dutch stakeholders in agriculture, food trade and research, the FAO database is more than a reference source. It can help companies, researchers, and policymakers benchmark supply chain losses across regions and commodities, identify knowledge gaps and spot opportunities for innovation, collaboration, and targeted investment.
The Netherlands is globally recognized for its expertise in efficient food supply chains, post-harvest technologies and logistics. Access to international food loss data can help Dutch companies and knowledge institutions identify where their solutions could make the biggest impact. The Permanent Representation of the Netherlands to the FAO in Rome actively supports these efforts by promoting international cooperation and knowledge exchange. Fabi also encourages researchers and practitioners to contribute new studies. Fabi adds: ‘There is a lot of information around the world, but it is very scattered. One of our priorities is to bring that information together so it becomes accessible to everyone.’
‘FAO can help benchmark supply chain losses across regions and commodities’
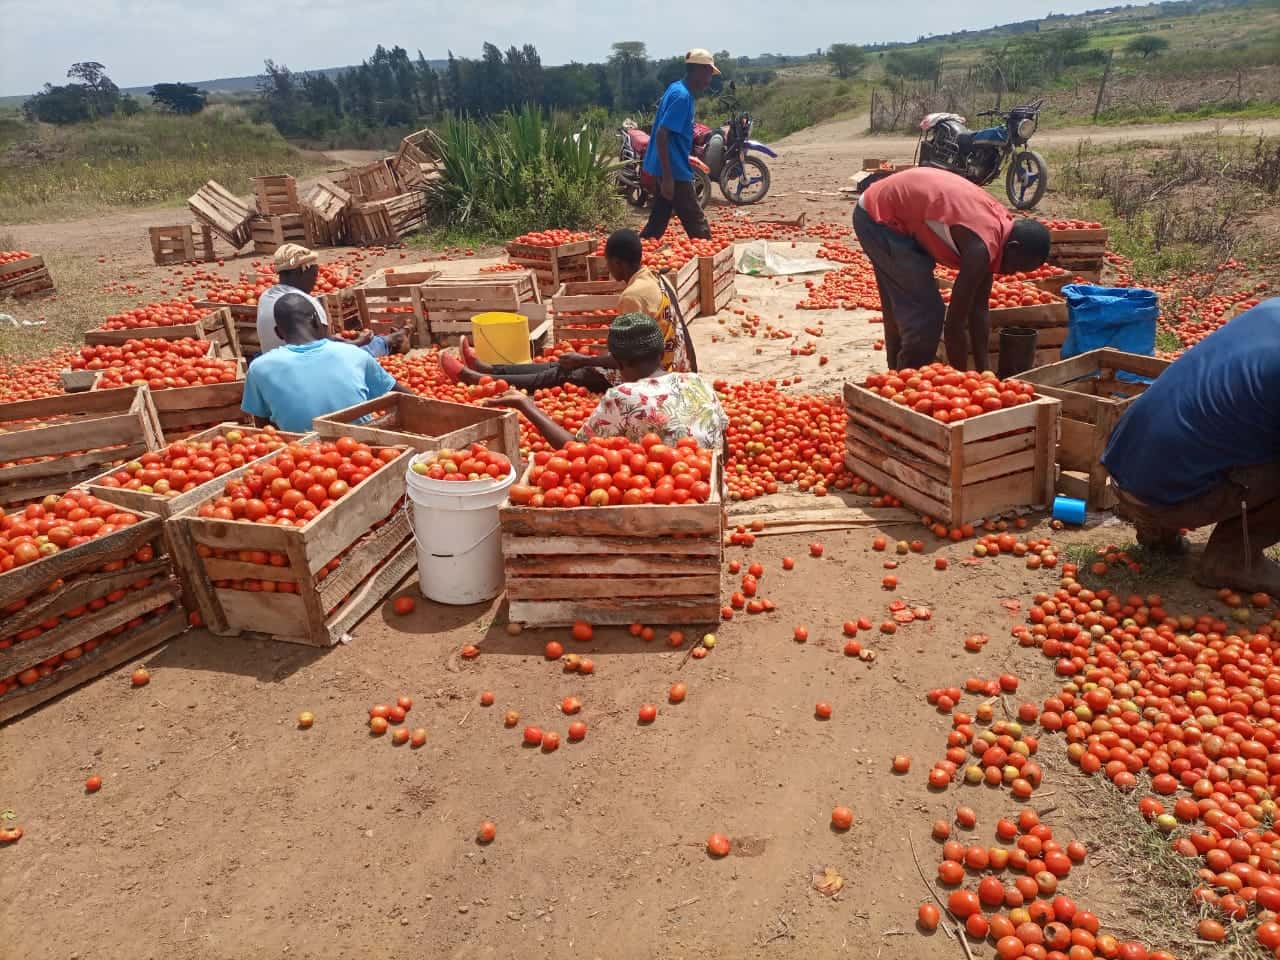
Beeld: © FAO
Tomato losses in Bungoma, Kenya. Source: Kenyan Ministry of Agriculture
More information
If you want to know more about FAO’s food loss and waste database, you can go to the page of the Permanent Representation of the Netherlands in Rome on this website. You can also send an email to Netherlands Agricultural Network (LAN) team at the PermRep in Rome: ROF@minbuza.nl.