Indonesia: Export and Import July 2020
This data and information are from the Indonesian Central Bureau of Statistics 2020, the link is available below.
IMPORT
- Indonesia's import value in July 2020 reached US $ 10.47 billion, down 2.73 percent compared to June 2020, and compared to July 2019, it decreased by 32.55 percent.
- Non-oil and gas imports in July 2020 reached US $ 9.51 billion or decreased by 5.70 percent compared to June 2020. Compared to July 2019, it also fell 30.95 percent.
- July 2020 oil and gas imports were valued at US $ 0.96 billion, an increase of 41.53 percent compared to June 2020, but compared to July 2019 it fell 45.19 percent.
- The largest decline in non-oil and gas imports in July 2020 compared to June 2020 was for the vehicle category and its parts valued at US $ 157.9 million (42.77 percent), while the largest increase was in the class of electrical machinery and equipment valued at US $ 220.9 million (15.77 percent).
- The three largest suppliers of non-oil and gas imports during January-July 2020 were China with US $ 21.36 billion (29.31 percent), Japan US $ 6.75 billion (9.26 percent), and Singapore US $ 4.86 billion (6, 66 percent). Non-oil and gas imports from ASEAN valued at US $ 13.94 billion (19.12 percent) and the European Union valued at US $ 5.77 billion (7.91 percent).
- The import value of all categories of goods used during January-July 2020 has decreased compared to the same period the previous year. The decline occurred in the category of consumer goods (7.15 percent), raw / auxiliary materials (17.99 percent), and capital goods (18.98 percent).
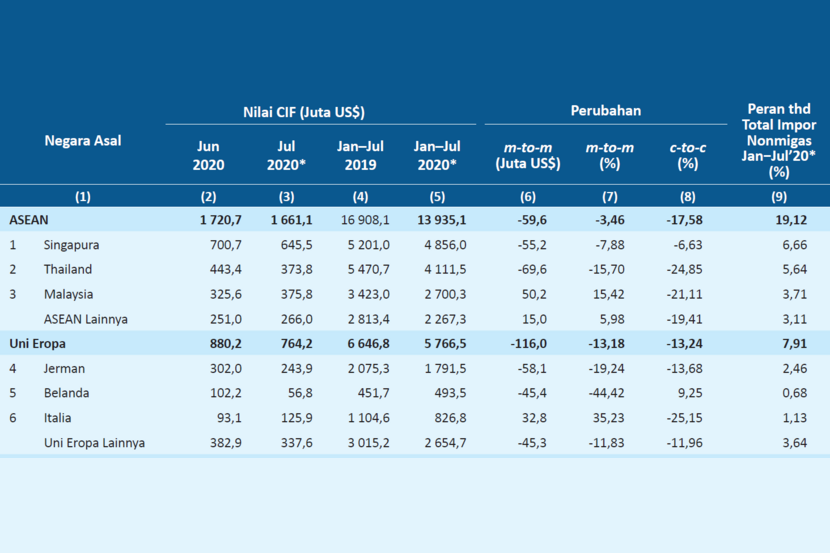
The total of non-oil and gas imports from January to July 2020 in percentage.
EXPORT
- Indonesia's export value in July 2020 reached US $ 13.73 billion, an increase of 14.33 percent compared to exports in June 2020. Meanwhile, compared to July 2019, it decreased by 9.90 percent.
- Non-oil and gas exports in July 2020 reached US $ 13.03 billion, up 13.86 percent compared to June 2020. Meanwhile, compared to non-oil and gas exports in July 2019, it decreased by 5.87 percent.
- Cumulatively, the value of Indonesia's exports from January to July 2020 reached US $ 90.12 billion or decreased 6.21 percent compared to the same period in 2019, likewise non-oil and gas exports reached US $ 85.44 billion or decreased by 3.96 percent.
- The largest increase in non-oil and gas exports in July 2020 against June 2020 occurred in precious metals, jewelry / gems amounting to US $ 452.7 million (79.79 percent), while the largest decrease occurred in metal ores, slag and ash amounting to US $ 100.5 million (33 , 07 percent).
- By sector, non-oil and gas exports from the processing industry from January to July 2020 fell 0.67 percent compared to the same period in 2019, likewise exports of mining products and others fell 22.14 percent, while exports of agricultural products rose 9.92 percent.
- The largest non-oil and gas exports in July 2020 were to China, namely US $ 2.53 billion, followed by the United States at US $ 1.61 billion and Japan at US $ 1.05 billion, with the three contributions reaching 39.82 percent. Meanwhile, exports to the European Union (27 countries) amounted to US $ 1.05 billion.
- According to the province of origin, Indonesia's largest exports in January-July 2020 came from West Java with a value of US $ 14.65 billion (16.26 percent), followed by East Java with US $ 11.54 billion (12.81 percent) and East Kalimantan with US $ 7 , 80 billion (8.65 percent).
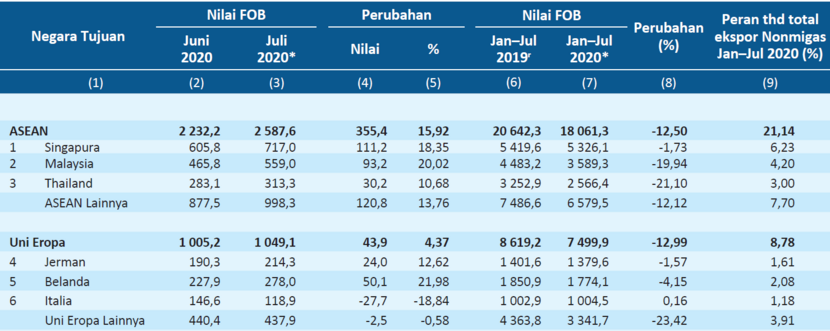
The total of non-oil and gas exports from January to July 2020 in percentage.
DISCLAIMER
The above materials from the Indonesian Central Bureau of Statistics 2020 are provided for informational purpose only. The content may include subjective parts and doesn't necessarily represents our own opinion. The Embassy therefore is not accountable for the objectiveness or accuracy of the content